April 30, 2023
U.S. new homes sales rose +9.6% m/m in March, but were still down -3.4% from a year ago. For Q1 as a whole, sales rose +9.0% q/q, down -16.1% from a year before.

US existing home sales fell -2.4% m/m in March, down -22.0% from a year ago.
The median sales price of new homes rose +3.8% m/m in March, up +3.2% from a year ago. The rate of increase is down significantly from last March, when it was up +21.2% y/y. For Q1 as a whole, prices fell -8.8% q/q, up just +1.4% from a year before.

The median sales price of existing homes rose +3.3% m/m in March, but was down -0.9% from a year ago.
The Case-Shiller U.S. National Home Price Index appears to have peaked last June. It rose +0.2 m/m in February, but was still up +2.0% from a year ago. (There is a several month lag in reporting this index).

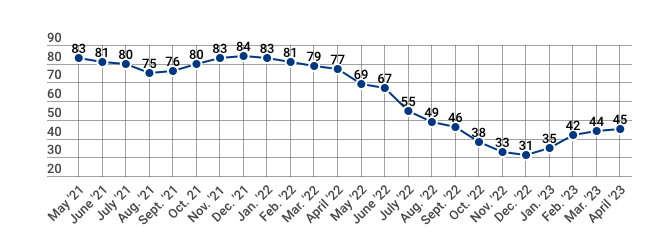
The NAHB/Wells Fargo Housing Market Index rose to 45 in April. It has been slowly recovering this year since reaching a low point of 31 in December.
US new housing starts fell -0.8% m/m in March, down -17.2% from a year ago. For Q1 as a whole, starts fell -0.2% q/q, down -18.9% y/y.

New residential construction permits fell -7.7% m/m in March, down -23.9% from a year ago. For Q1 as a whole, permits rose +2.8% q/q, but were still down -22.6% y/y.

U.S. private residential construction spending peaked in May. It fell -0.2% m/m in March, down -10.0% from a year ago. For Q1 as a whole, spending fell -3.3% q/q, down -7.7% y/y. These numbers are not adjusted for inflation, so the decline in real terms is deeper.

The 30-year fixed mortgage rate is currently about 6.4%. That is down from its peak of nearly 7.1% in October-November, but still 1.1 percentage points higher than it stood a year ago.

According to recent consumer sentiment surveys by the University of Michigan, higher mortgage rates have been a significant factor in potential home-purchasers willingness to buy.

Leave a Reply