December 13, 2022
US consumer prices (CPI) rose +0.1% m/m in November, lower than expected, up +7.1% from a year ago (down from a peak of +9.0% y/y in June).

Core CPI (excluding food and energy) rose +0.2% m/m in November, less than expected, up +6.0% from a year ago (down from +6.7% in October).

Consumer food prices rose +0.5% m/m in November, up +10.7% from a year ago (down from a peak of +11.4% y/y in August). Food prices remain historically elevated.

Consumer energy prices fell -1.6% m/m in November, but were still up +13.0% from a year ago. They peak in June.

As of December 12, average gasoline prices across the US have fallen to $3.24 per gallon, down from a peak of $4.96 per gallon in June, their lowest price since January 2022.

U.S. producer prices (PPI – final demand) are often seen as a leading indicator (albeit more volatile) of consumer price pressure. They rose +0.3% m/m in November, up +7.4% from a year ago (down from a peak of +11.7% y/y in March).

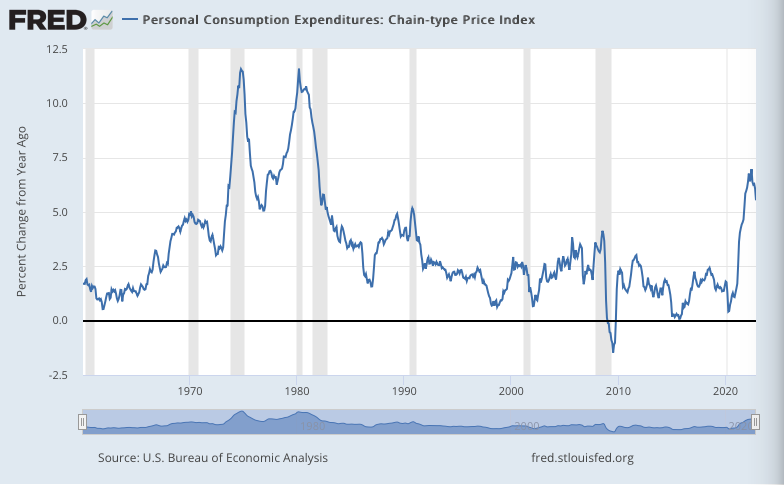
The PCE (Personal Consumption Expenditures) price index, produced by the BEA, offers an alternative to the BLS’s CPI, one often preferred by the Federal Reserve. PCE rose +0.1% m/m in November, which equates to an annualized rate of +1.3%. Measured by PCE, consumer prices were up +5.5% from a year ago, down from a peak of +7.0% y/y in June.
Core PCE (excluding food and energy) rose +0.2% m/m in November, which equates to an annualized rate of +2.0%. Core prices were up +4.7% from a year ago, down from a peak of +5.4% y/y in February.

Leave a Reply