July 27, 2023
At its July 2023 meeting, the Federal Reserve’s FOMC announced it was raising the Fed Funds Rate by 25 bps to a range between 5.25% and 5.50%, noting that unemployment remains low and inflation remains elevated. The rate hike in May was, at the time, widely anticipated to be the last in the cycle. However, that expectation gradually shifted and this latest rate hike was not unexpected.

The Fed’s statement can be found here.
This chart offers a longer-term perspective on the Fed Funds rate, which is now at its highest level since July 2007.

Following its June meeting, the Fed released this latest “dot plot” (published quarterly) of where FOMC members expect the Fed Funds rate to move in the future. The median expectation was for one more 25 bps rate hike this year (on top of the July hike), before starting to pull back. This median is 50 bps higher than the same dot plot indicated in March.

As of July 25, the yield on 10-Year Treasuries is at 3.91%, up 110 bps from a year ago.

The spread between 10-year and 2-year Treasury yields remains negative, since July 2022. A negative “yield curve” is often seen as a leading recession indicator.

The U.S. Treasury yield curve (currently inverted, as of July 26), compared to one year ago where it was mostly flat, and two years ago when it was upward-sloping.

As of July 25, the spread on high-yield bonds stands at 384 bps, down 93 bps from a year ago. The spread is often seen to reflect perceived credit risk in the economy.

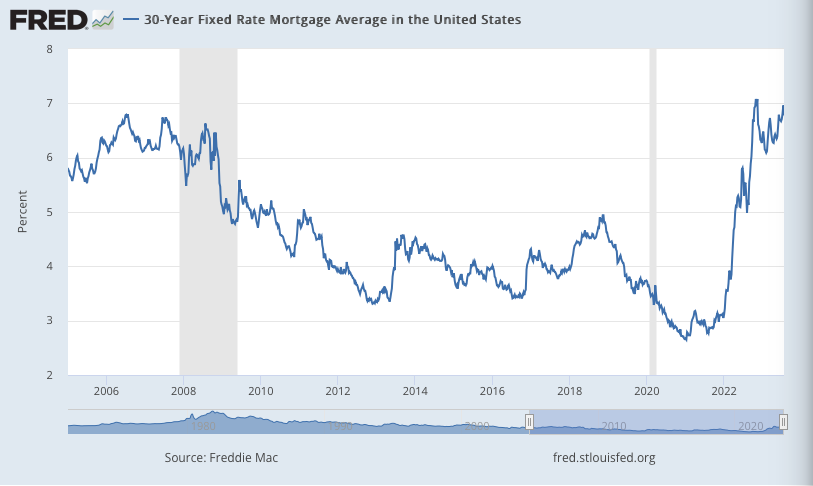
As of July 20, the U.S. 30-Year Fixed Mortgage Rate stands at 6.78%. It has been rising again, though it remains shy of its recent peak of 7.08% in October. Mortgage rates have risen sharply from 3.11% at the end of 2021, driven by Fed rate hikes.
Leave a Reply