January 28, 2023
US consumer prices (CPI) fell -0.1% m/m in December, up +6.4% from a year ago. This is down from a peak of +9.0% y/y in June.

Core CPI (excluding food and energy) rose +0.3% m/m in December, up +5.7% from a year ago. This is down from a peak of +6.7% y/y in September.

US consumer food prices (CPI) rose +0.3% m/m in December, up +10.4% from a year ago. This is down only slightly from a peak of +11.4% y/y in August.

US consumer energy prices (CPI) fell -4.5% m/m in December, thought they remain up +7.0% from a year ago. This is down from a peak of +41.5% y/y in June.

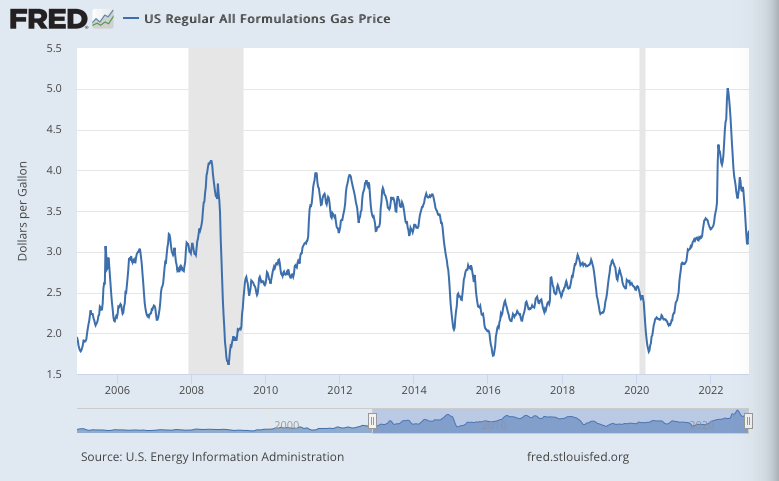
As of January 9, average gasoline prices across the US stood at $3.26 per gallon, down from a peak of $4.96 per gallon in June. That was up +1.1% from a month ago and down -1.1% from a year ago.
The US price of housing shelter (CPI) rose +0.8% m/m in December, up +7.5% from a year ago, its highest y/y rate since July 1982.

While overall inflation seems to be cooling, driven in part by falling energy prices, US prices for basic necessities such as food and shelter are showing continued upward pressure, which may explain why many people don’t feel much better.
US producer prices (PPI – final demand) fell -0.5% m/m in December. They were still up +6.2% from a year ago, but that is down from a peak of +11.7% y/y in March 2022. PPI is often seen as a (more volatile) leading indicator of the direction of consumer inflation.

The PCE (Personal Consumption Expenditures) price index, produced by the BEA, offers an alternative to the BLS’s CPI, one often preferred by the Federal Reserve. The PCE price index rose +0.1% m/m (an annualized rate of +0.6%) in December, up +5.0% from a year ago. That is down from a peak of +7.0% y/y in June.
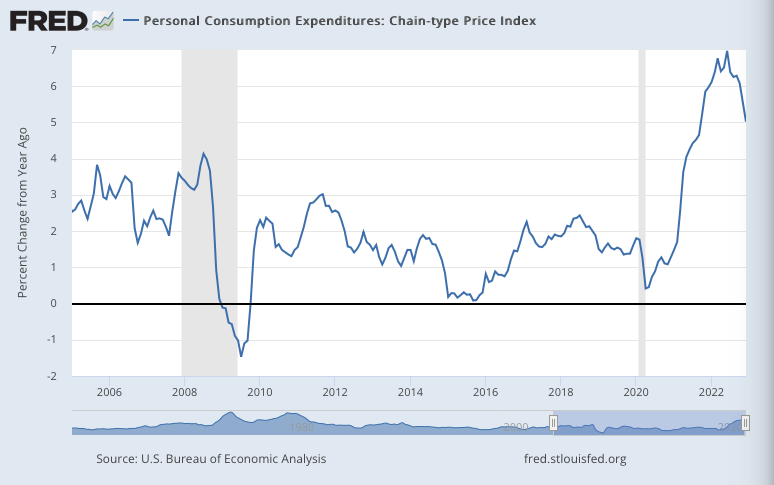
It’s often hard to read from a single month’s m/m change unless there’s a trend. But there clearly is a trend, in the last few months, towards lower inflation. The annualized q/q rate in Q4 was +3.2%, down from +7.3% in Q2.

Core PCE (excluding food and energy) rose +0.3% m/m in December, up +4.4% from a year ago. This is down from its peak of +5.4% y/y in February.

The downward trend in m/m Core PCE momentum is not as obvious, but is still present. The annualized q/q rate for 4Q22 was +3.9%, down from a peak of +6.1% in 2Q21.

In terms of annual inflation rate, PCE for 2022 was up average of +6.2% from 2021, compared to 2021 which was up an average of +4.0% from 2020. Core PCE for 2022 was up an average of +5.0% from 2021, compared to 2021 which was up an average of +3.5% form 2020.
The annual rates offer some perspective on overall price increases that consumers have felt up to now, while the q/q or m/m annualized rates give a better snapshot of current inflation momentum cooling.
Leave a Reply